Hi there. My name is John Greene. I am a PhD student studying geophysics at Texas A&M, and today I will be telling you all about multibeam bathymetry.
Throughout history, water depth has been one of the fundamental measurements taken by vessels at sea. This used to be done with the very tedious method of repeatedly lowering a line weighted with lead to the water bottom. Thankfully, we now use the travel time of a sound pulse reflecting from the seafloor to determine depth (much easier and faster). By recording depths using a large number of sound pulses spread below the ship and to either side, we can “image” (map) the seafloor topography. This is the basic concept behind multibeam bathymetry.
On the Langseth, the multibeam bathymetry system is mounted to the hull on a pod. We are using the “Kongsberg EM122 echo sounder”, which can be seen in the pictures below (they wouldn’t let me dive in to take a picture, so here are some from when the ship was in dry dock).


To map the features of the seafloor, the multibeam system sends out a fan (swath) of 12kHz sound wave beams extending from side to side beneath the ship. These travel to the ocean bottom and reflect back to us. Accurate timing of exactly how long it takes for the sound wave to travel to the seafloor and bounce back combined with the velocity of sound in water (somewhere around 1,500 meters per second) allows the system to calculate the depths to seafloor features located beneath us on either side. Overall, our coverage is about a 12-kilometer width of seafloor (6 kilometers off both the port and starboard sides). As we move along, we are able to combine these measurements together in sequence, giving us a picture of the seafloor we are traversing.

Since the ship is constantly pitching, rolling, and heaving, the measurements (soundings) from the seafloor have to be corrected so the features they bounced from can be given an accurate depth and location. It also takes into account the slightly varying sound velocity (that we can measure; more on that later), which affects the calculated depth.
Even after all of the corrections, the data still needs to be processed before it can be turned into a beautiful image of the seafloor. Erroneous measurements result in depths that are either much too shallow or deep for what could reasonably have come from the seafloor. We use a program named “Caris”, which displays all of the depth soundings in each swath of data. Any point that is clearly erroneous can then be deleted until the remaining represents an accurate return from the seafloor. This task is done daily for the previous 24 hours of multibeam data collected.

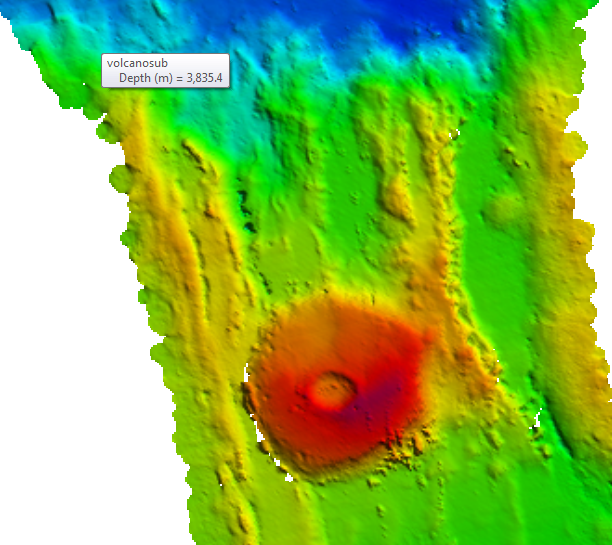
Since we are sailing in a pretty remote, unmapped area, we are the first people ever to discover the features that show up in the multibeam. Occasionally we come across something incredible (like the underwater volcano below)!
After the cruise, the multibeam data will be a valuable addition to our science objectives and the science community as a whole. NOAA estimates that “95 percent of [the ocean] remains unexplored, unseen by human eyes”, so anything we collect helps chip away at this figure. Additionally, Google Earth incorporates multibeam data from research cruises into its display, so someday the data we collect will be visible to anyone using Google Earth!


Wow! How cool to have made this discovery! Thanks for sharing it with us!
LikeLike
Hi there John, Thank you so much for the report… and education! So cool that you and your mates are making such awesome discoveries…. And, thank you for posting all the pics!!!
What about naming the volcano “South Peak”…. perhaps with the coordinates incorporated into the name?? Cheers
LikeLike
Ocean Fire.
Deep Crest.
Hot Tub.
LikeLike
Hi John,
We love all the blog entries! Thanks to everyone for giving us a glimpse into your world and adventures! Dad and I will try to come up with a good name for the volcano discovery. 🙂
LikeLike
Great posts, thanks for keeping us updated! How about MakeVolcanoesGreatAgain?
LikeLike